Manual / Operations Report
Operations Report
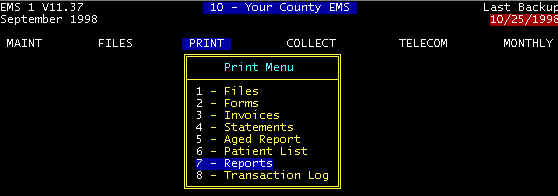
Screen 1 Main Menu-PRINT
�
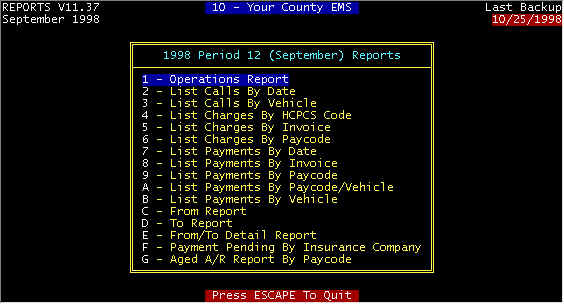
Screen 2 PRINT/Reports
�

Some providers do not always know the month's expense, and simply accept
the default amount of zero pressing the <ENTER> key. If you know the
expenses, then calculations such as cost per call, for example, are calculated and
printed. For the sample printout below, expenses were accepted as zero.
OPERATIONS REPORT
12/02/98 Your County EMS Page 1 1998 Period 12 (September) Operations Report ------- This Year ------ ------- Last Year ------
Month Year To Date Month Year To Date
----------------------------------------------------------------------
Total Calls 301 3636 231 2344
      Total Expenses            0.00          0.00        0.00          0.00
         Per Call               0.00          0.00        0.00          0.00
      Cash Income           60610.49     761601.00    37651.95     350576.38
         Per Call             201.36        209.46      163.00        149.56
      Non Cash Income       29059.85     548947.53    24487.64     687141.32
         Per Call              96.54        150.98      106.01        293.15
      Total Sales          110640.00    1372646.00    87070.00     827590.42
         Per Call             367.57        377.52      376.93        353.07
      A/R Balance           20969.66     400222.60    24930.41     417028.47
      ----------------------------------------------------------------------
      Collection Rate          54.78         55.48       43.24         42.36
      ----------------------------------------------------------------------
Non Cash Income Summary ------- This Year ------ ------- Last Year ------
Month Year To Date Month Year To Date
----------------------------------------------------------------------
Discounts 0.00 385.00 0.00 0.00
      Total Writeoffs       29059.85     548562.53    24487.64     687141.32
        Unclassified           96.09       1154.62       25.00       4329.16
        Medicare Contract   20400.99     336221.26    18797.59     177570.11
        Medicaid Contract    4540.00      34236.11     2258.00      13570.87
        Charity              2347.42      17567.88      247.93        961.00
        Bad Debt              353.32      57072.95      727.01       8722.62
        Other                1322.03     102309.71     2432.11     481987.56
      ----------------------------------------------------------------------
      Adj. Collection Rate     70.72         75.99       57.04         55.08
      Cash Income From Deposits.......:   79290.12
      Cash Income From Collections....:     101.00
      Cash Adjustments (refunds, etc.):  -18679.63
|
Definition of contents and calculations:
- Period 12 -- This is the 12th billing period of the fiscal year. In this case it is for the month of December.
- Cash Income -- Total cash posted minus Cash Adjustments (refunds, etc.)
- Non Cash Income -- Writeoffs and discounts
- Total Sales -- Total Charges Posted
- A/R Balance -- Total Balance of all invoices combined
- Collection Rate -- Cash Income / Total Sales, expressed as a percent -- Collection Efficiency
- Discounts -- Sum of all posted to paycode 8 -- discounts
- Unclassified Writeoffs -- A catch all writeoff category meaning whatever you want it to mean
- Medicare Contractual Writeoffs -- By law if you accept assignment, you must write off the difference between what you charge (bill on a claim) and what Medicare allows on your EOMB -- this is uncollectable charges
- Medicaid Contractual Writeoffs -- Same as above
- Charity Writeoffs -- Those services that you may enter, but writeoff for charitable reasons
- Bad Debt Writeoffs -- Accounts that eventually write off simply because you cannot collect
- Adjusted Collection Rate -- Cash Income divided by (Total Sales-Contractual Writeoffs). You should not penalize your collection efficiency by accounting for uncollectible charges. This is a better indication of collection efficiency than Collection Rate (above), and is a figure of merit of how effective you are collecting.
- Cash Income From Deposits -- Should match your total bank deposits. This is another way of balancing payments posted with bank deposits. If you print this report before and after posting, then your deposit slip should equal the difference in these two numbers on this report. There are three other reports you can print for daily balancing bank deposits with payments posted -- List Payments By Invoice, Print Transaction Log, and List Payments By Paycode
- Cash Income From Collections -- Total of all payments posted to invoices with a collection status
- Cash Adjustments (Refunds, etc.) -- Payments that are posted as a negative number, and are usually refunds. However, if you are making a negative adjusting entry for a previous billing period, this is also included in this amount